Introduction

Qucklinks

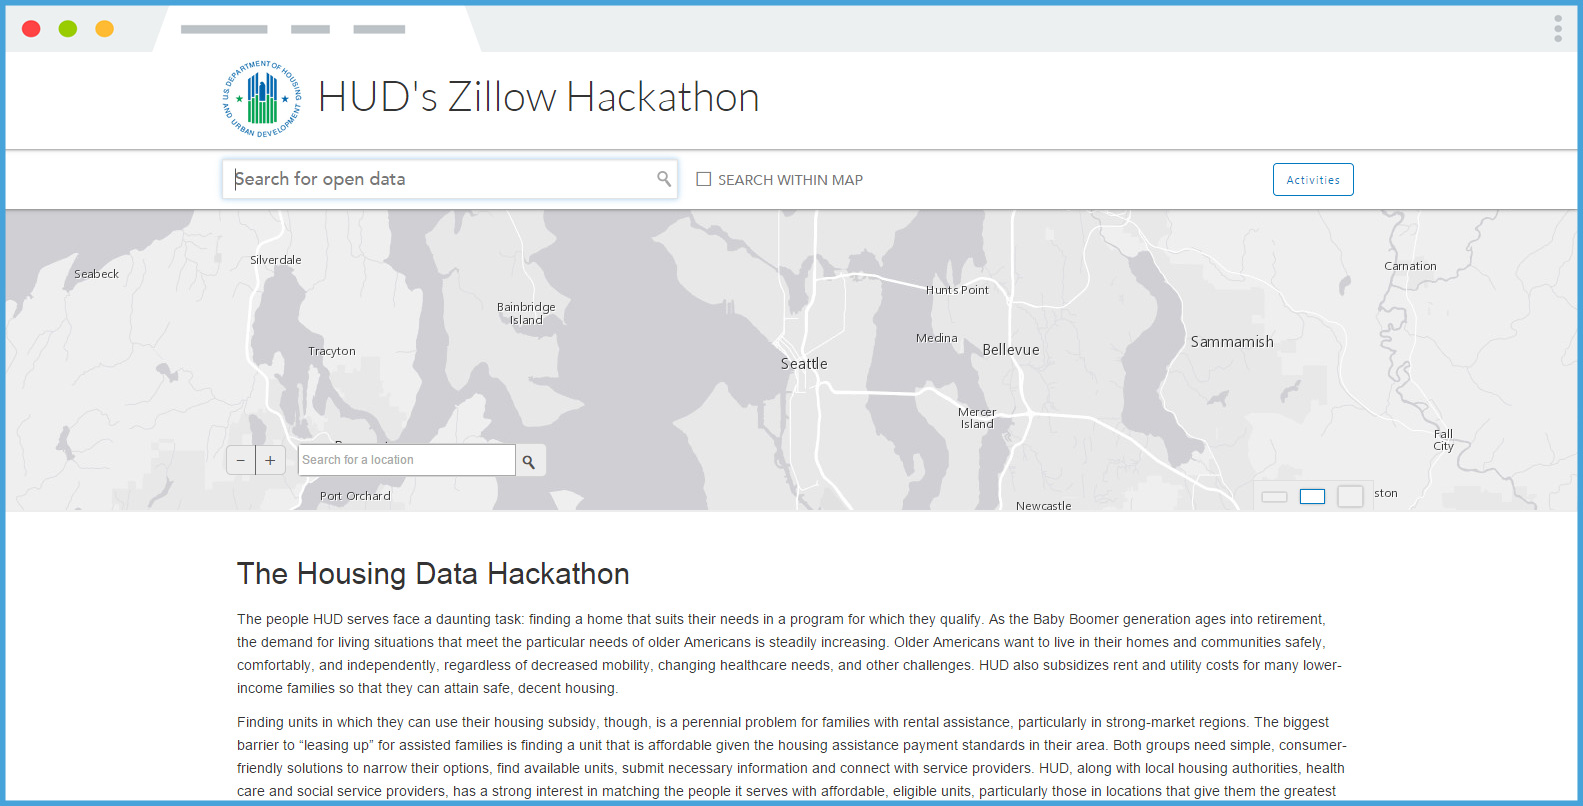
Purpose of the hackathon

The people HUD serves face a daunting task: finding a home that suits their needs in a program for which they qualify. As the Baby Boomer generation ages into retirement, the demand for living situations that meet the particular needs of older Americans is steadily increasing.

Older Americans want to live in their homes and communities safely, comfortably, and independently, regardless of decreased mobility, changing healthcare needs, and other challenges. HUD also subsidizes rent and utility costs for many lower-income families so that they can attain safe, decent housing.

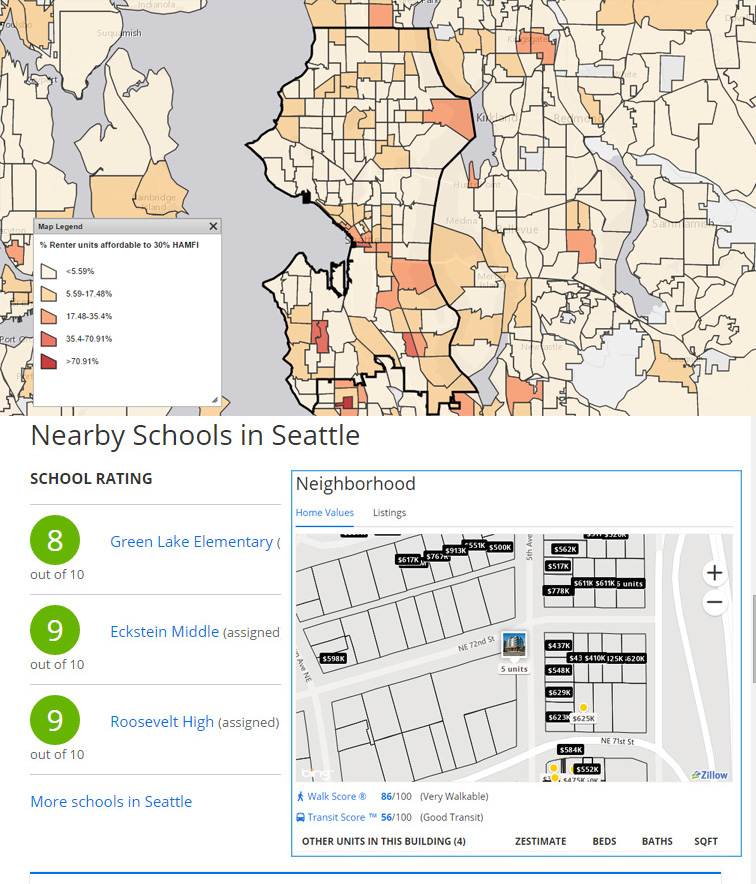
Finding units in which they can use their housing subsidy, though, is a perennial problem for families with rental assistance, particularly in strong-market regions. The biggest barrier to “leasing up” for assisted families is finding a unit that is affordable given the housing assistance payment standards in their area. Both groups need simple, consumer-friendly solutions to narrow their options, find available units, submit necessary information and connect with service providers.

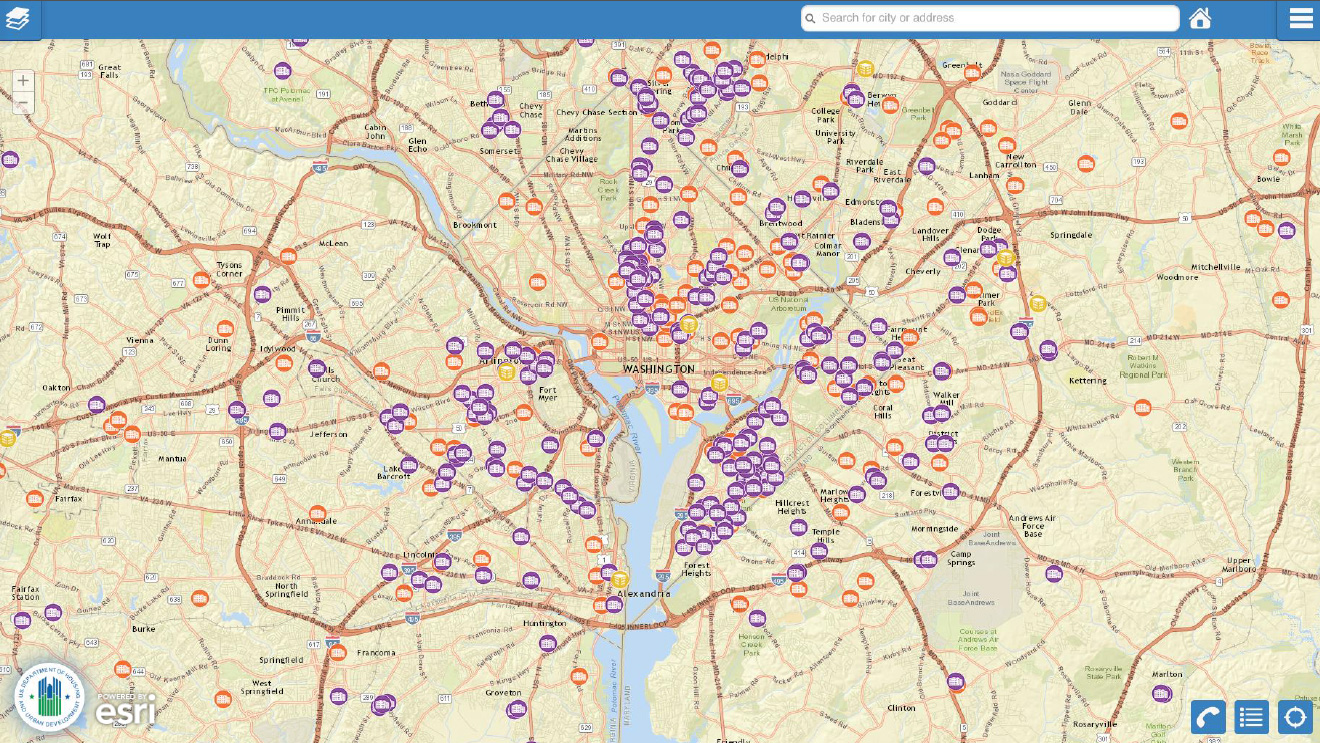
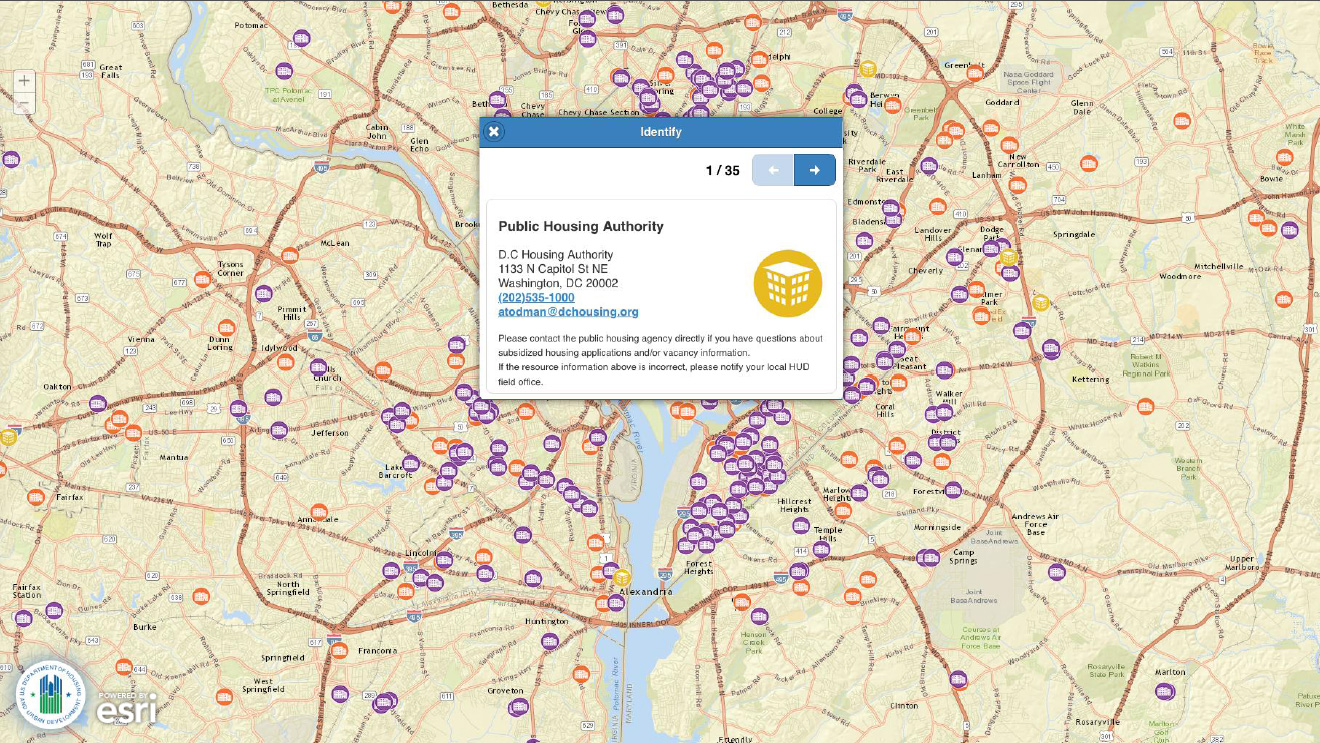
HUD, along with local housing authorities, health care and social service providers, has a strong interest in matching the people it serves with affordable, eligible units, particularly those in locations that give them the greatest chance of succeeding: neighborhoods with access to transit, local retail, good schools, social services, and employment opportunities. But people need better information about the availability of accessible units, access to social services and neighborhood amenities, and features that suit their individual needs—including wheelchair access, walking, and public transportation.

HUD Provided Data

What we hope to get out of the hackathon

  • We're looking for more context
    • Our data is only a small part of the full picture and we rely on local data or data from other sources

  • A fresh perspective
    • Census provides great aggregated estimates, but Zillow data is up-to-date and specific

  • Targeted Applications
    • We'd like to focus on apps that assist our service providers and customers

  • A Continuing Relationship
    • We'd like to foster collaboration wherever possible and engage in more hackathons!

How to ask questions


Or come talk to us

Logan Powell - Census
Rick Campbell - Census
Jeff Meisel - Census
Rob Renner - HUD
Connor McDonnell - HUD
Josh Geyer - HUD
Sean Turner - HUD
Shula Markland - HUD


Location Affordability Index Deep Dive

Index Specifications

  • Description
    • Indicates housing and transportation costs as a percentage of income for various household profiles at the neighborhood level

  • Geographical unit of analysis
    • Census block group

  • Coverage area
    • All populated areas in the 50 states and District of Columbia

  • Last update
    • August 2014 (2008-2012 ACS)

  • Detailed methodology

LAI Data

  • Data dictionary
  • Four types of data:
    • Index - housing and transportation costs by household profile
    • Transportation behavior
    • Housing costs
    • Built environment
    • Household profiles
    • Geographical - census FIPS codes

Data hierarchy

Location Affordability Index

Transportation Costs

Transportation Consumption


Housing Costs


Demographics

Built Environment

Input Data - Built Environment

  • Population density - households/area
  • Walkability - city blocks/area
  • Employment access - Employment Access Index, Retail Employment Index, Median Commute Distance
  • Commercial amenities - local job density, local retail density
  • Housing stock - % units that are rentals, % units that are SF detached, # of rooms/occupied unit for O/R*
    • *O/R = denotes separate variables for owners and renters

Input Data - Demographics

  • O/R incomes as fraction of ara median income
  • Household profiles - area median income, average HH size for O/R, average commuters/HH for O/R
    • *Model is run for eight different (fictional) profiles across each metropolitan area to meet needs of variety of users
Household Type Income HH Size # of Commuters
Median-Income Family MHHI 4 2
Very Low-Income Individual National poverty line 1 1
Working Individual 50% of MHHI 1 1
Single Professional 135% of MHHI 1 1
Retired Couple 80% of MHHI 2 0
Single-Parent Family 50% of MHHI 3 1
Moderate-Income Family 80% of MHHI 3 1
Dual-Professional Family 150% of MHHI 4 2

Modeled values

  • Uses Simultaneous Equations Modeling – regression technique
  • Housing costs for owner and renter households fitting the eight household profiles
  • Transportation consumption for owner and renter households fitting the eight household profiles:
    • Average autos owned/HH
    • Average annual VMT
    • % of commuters using transit

Transportation costs

  • For auto ownership and usage, takes modeled transportation consumption estimates and multiplies by unit costs:
    • Auto ownership cost = auto/HH * cost per auto
    • Auto usage cost = annual VMT * cost per mile

  • More detail on annual transit trips and costs

Location Affordability Index

  • Composed of (housing + transportation costs)/income for each household profile (owners and renters) for each block group
  • Data contains separate and combined percentages

HUD Resource Locator

HUD Resource Locator

HUD Resource Locator

HUD Resource Locator

HUD Resource Locator

HUD Resource Locator

HUD Resource Locator

HUD Resource Locator


Open Data Reflections for HUD

Topics

  • Data.gov
  • Open Data
  • The Importance of Making Government Data Open
  • Housing Hackathon
  • Upcoming Goals and Objectives
  • Open Discussion/Questions and Answers

Data.gov

Open Data

  • On May 9, 2013 - Executive Order 13642 – Making Open and Machine Readable the New Default for Government Information
  • Open Data Policy M-13-13 – Managing Information as an Asset
  • Completed HUD’s Enterprise Data Inventory

Importance of Making Government Data Open

  • Making government data more open and accessible to innovators and the public, fuels entrepreneurship and economic prosperity while increasing government transparency and efficiency
  • Two big examples:
    • Public release of weather data from government satellites and ground stations generated an entire economic sector that today includes the Weather Channel
    • Decision to make the Global Positioning System (GPS), once open only to the military for use, available for civilian and commercial access, gave rise to GPS-powered innovations ranging from aircraft navigation systems to precision farming to location-based apps, contributing tens of billions of dollars in annual value to the American economy.

Importance of Making Government Data Open (Continued)

Housing Hackathon

  • Made additional GIS datasets available to our partners in the private sector
    • Overwhelming turn out
    • Teams working on completing innovative tools

Upcoming Goals & Objectives

  • Continue to make valuable HUD data available openly and public but protect privacy
  • Continue to identify HUD’s largest consumers of data
  • Identify what additional data types our customers need

Questions & Answers


Shula Markland

Senior Data Architect

Department of Housing and Urban Development

202-402-8335 (office)

shula.markland@hud.gov


City SDK

City SDK

New 2015 Initiative from Census to Make Open Data Easier to Use

City SDK Beta Release

City SDK Beta Release - Coming Soon in May 2015

Project Page on Github

bit.ly/city-sdk

Help Us Improve

Provide feedback to Zillow and collaborators

bit.ly/hhfeedback

About PD&R

The U.S. Department of Housing and Urban Development's (HUD's) Office of Policy Development and Research (PD&R) supports the Department's efforts to help create cohesive, economically healthy communities.

Social Links

PD&R HQ

451 7th Street S.W.
Washington, DC 20410
Telephone: (202) 708-1112
TTY: (202) 708-1455